
What’s the best way to create great looking charts in Java? It looks like the main option for charting is JFreeChart, but unfortunately by default they come out looking quite plain.
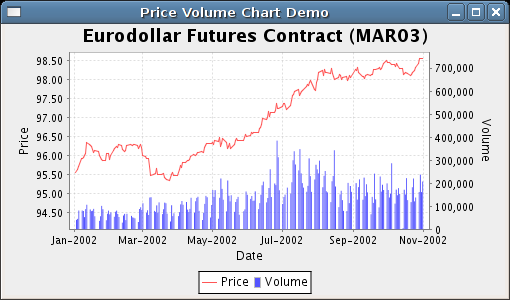
Compare a sample of JFreeChart: http://www.jfree.org/jfreechart/images/PriceVolumeDemo1.png with one of the Javascript charting libraries, eg http://www.highcharts.com/demo/spline-symbols/grid or http://people.iola.dk/olau/flot/examples/graph-types.html
The javascript ones look nicer – they have smooth lines, nice font by default, and just overall look good compared to JFreeChart which looks very plain.
Is there a charting library built on top of JFreeChart that looks good by default, or maybe some sample code to make a normal JFreeChart chart (eg line chart) look great?
Advertisement
Answer
http://www.jfree.org/jfreechart/samples.html
There you can find many samples (you need to download a JFreeChart Demo (web start)). After some work with jFreeChart, I was thinking about moving to EasyChart (follow: http://www.objectplanet.com/easycharts/examples.html), but it looks very similar to jFreeChart actually. JFreeChart is quite easy to write, that I don’t know about EasyChart.
But according to your question, there is no problem to change a Font, LineRenderer or anything from desing in JFreeChart, so you can modify it to look exactly like the one you’ve posted from JavaScript.